


Welcome to the Cyclistic bike-share analysis case study! In this case study, I have performed many real-world tasks as a junior data analyst. I worked for a fictional company, Cyclistic.
Cyclistic is a bike-share company in Chicago. The director of marketing believes that the company’s future success depends on maximizing the number of annual memberships. Therefore, I am tasked with understanding how casual riders and annual members use Cyclistic bikes differently. From these insights, my team will design a new marketing strategy to convert casual riders into annual members.
Background:
The Product:
5,824 bicycles and 692 docking stations
More than 50% of riders select traditional bikes.
8% of riders opt for the assistive bike options.
30% of users bike to commute to work each day.
Users are more likely to ride for leisure.
Casual riders have chosen Cyclistic for their mobility needs.
The Customers
Casual Customers - Who purchased single-ride or full-day passes.
Cyclistic Members - Who purchase annual memberships.
Goals and Expectations -
| Stakeholders | Expectations | Project/Business Goals |
| Cyclistic Executive Team | A detail-oriented executive team that decides whether to approve the recommended marketing program. | Producing strategies for business growth. |
| Lily Moreno, Director of Marketing (manager) | Responsible for the development of campaigns and initiatives to promote the bike-share program. | Increasing the number of annual memberships by converting casual riders. |
| Marketing analytics team | Understanding the differences and motivations behind different customer types. | Produce data-driven results to inform business decision-making. |
Problem Statement -
Cyclistic is facing an uncertain future which is rendering its future traditional marketing strategies. Identifying the necessity for company expansion, the director of marketing believes in capitalizing on the lucrative profit margin associated with the annual members. The suggested approach involves targeting existing casual customers and converting them into yearly subscribers. To facilitate this transition, a comprehensive analysis of the distinctions between Cyclistic's casual bikers and members is crucial, shedding light on evidence, opportunities, and potential barriers to the envisaged marketing strategy
The Challenge (Business Questions):
Converting casual riders into annual members.
To do that, however, the marketing analyst team needs to better understand:
How do annual members and casual riders differ?
Why casual riders would buy a membership?
How digital media could affect their marketing tactics?
Our team is interested in analyzing the Cyclistic historical bike trip data to identify trends.
To answer the key business questions, I followed the steps of the data analysis process:
Ask
Prepare
Process
Analyse
Share
Act
Deliverables :
Prepare -
●Choosing datasets, outlining their location and how the data is organized.
● Determining the credibility of the data, Does the data ROCCC(R - Reliable, O - Original, C - Comprehensive, C - Current , C - Credible) .
● Addressing authenticity (licensing, privacy, security, and accessibility).
● Verifying the data’s integrity.
● Identifying how it helps to answer the questions being asked.
Data Source:
The data that I have worked with has been extracted from here. The data has been made available by Motivate International Inc. under this license.
Note that the datasets have a different name because Cyclistic is a fictional company. For this case study, the datasets are appropriate.
The dataset consists of a bunch of numbers that tell us about bike trips over time. Each data point represents the bike trip from one docking station to another. But just looking at these numbers might not tell us everything about how regular riders and members use Cyclistic bikes differently. For that purpose, we need more data to understand why. We should ask both regular riders and members some questions to understand things better. Questions like "For what reasons do they use cyclistic bikes?" and "Is there anything that is coming in their way to not use cyclistic bikes? If yes, what is it?" would give us the insights we need.
Here, I have used the dataset incorporating an entire year i.e. from January 2022 to December 2022. Each month has a separate comma-separated value (CSV) file. Each record consists of a bike trip under the bike-sharing program composed of different columns: ride_id, rideable_type, started_at, ended_at, start_station_name, start_station_id, end_station_name, end_station_id, start_lat, start_lng, end_lat, end_lng (these 04 columns represent the starting and ending latitude and longitude of rides), and member_casual.
Data Quality :
The dataset is original,
Comprehensive,
Reliable,
Updated,
Accurate.
Ethical Concerns
Licensing: This dataset is constrained by the license.
Privacy: The dataset is prohibited from revealing customers' personal information.
Security: The dataset is in a cloud repository and it is secure by a trusted and well-known global cloud services provider.
Accessibility: All of the records of bike rides are public but also with some constraints.
Credibility: The data provided by Motivate International Inc. can be trusted to accurately represent the facts.
Data Integrity
The data provided is proper and intact, however, there are some inconsistencies due to its time series nature. Overall the data is integrated and well presented which is helpful during work.
Purpose
Identifying trends and patterns to differentiate between both the riders (annual members and casual riders) and how they use the bikes differently.
Process data for analysis
Research and use the appropriate data manipulation tools for processing and analysis.
Check for unclean data - especially data that is outdated, duplicated, incomplete, inconsistent, or inaccurate.
Clean and transform the data to a stage where it can be effectively used in analysis.
Choosing the right tools for the task
Considering the relatively small size of our combined dataset, I used Power Query for data manipulation and visualization. Since the entire combined dataset fits comfortably in RAM, most basic operations have been completed within a few seconds. All of my data cleaning, transforming data, deleting missing values and inserting new columns are done in power query only.
Data Calculations:
● Calculated the average ride_length for members and casual riders.
● Calculated the average ride_length for users by day_of_week.
● Calculated the number of rides for users by day_of_week by adding Count of trip_id to Values.
After all the cleaning and calculations, I performed my final analysis in Power query.
Trends & Patterns (Charts) :
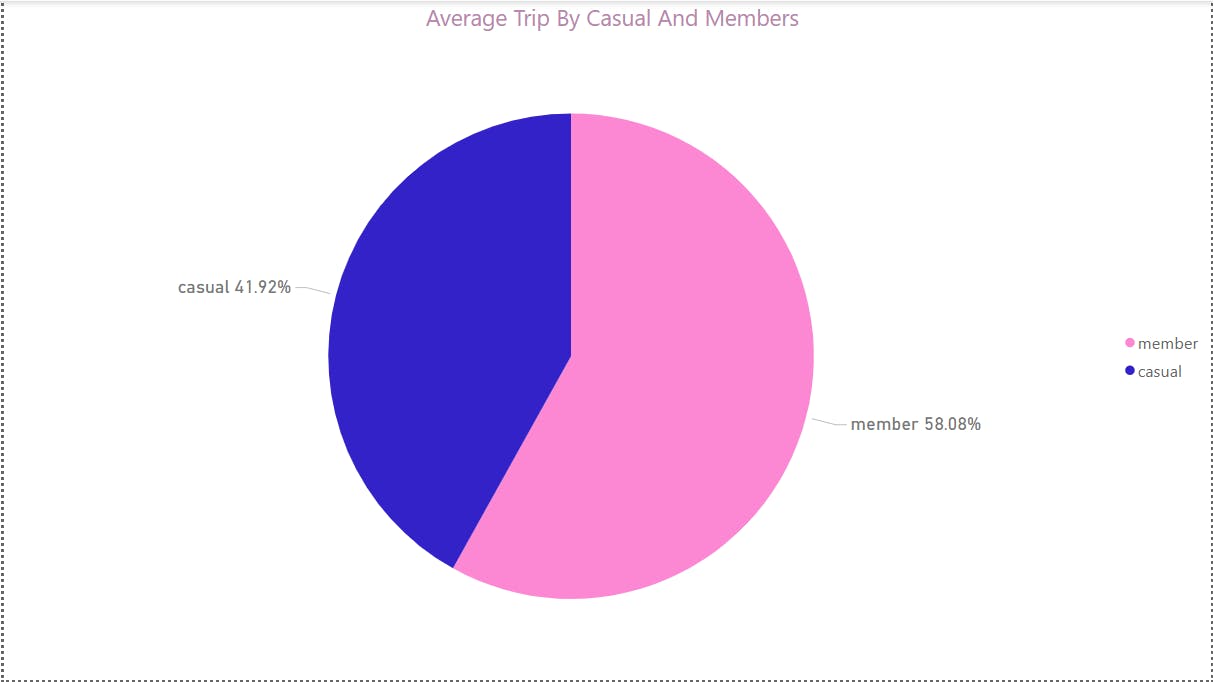
Casual riders account for 42% of the average rides, while annual members contribute 58% of the average rides throughout the entire year. This insight indicates that annual members are a valuable asset to the company
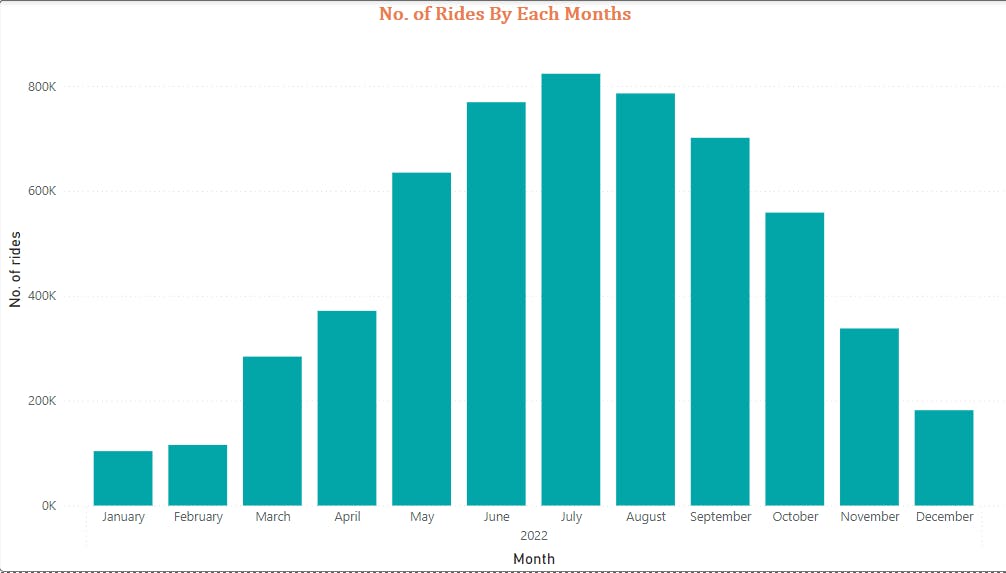
The highest number of bike rides occurred in the months of May, June, July, August, and September.
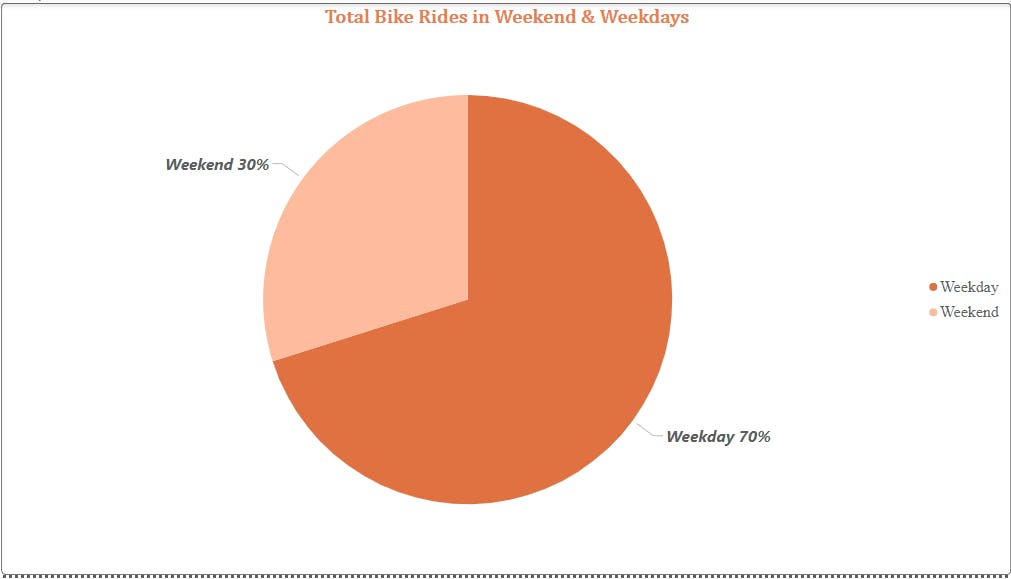
The total rides on weekends account for 30%, while weekday rides make up 70%. Since a weekday consists of 5 days and a weekend only 2, it implies that a higher number of rides occur during the weekend.
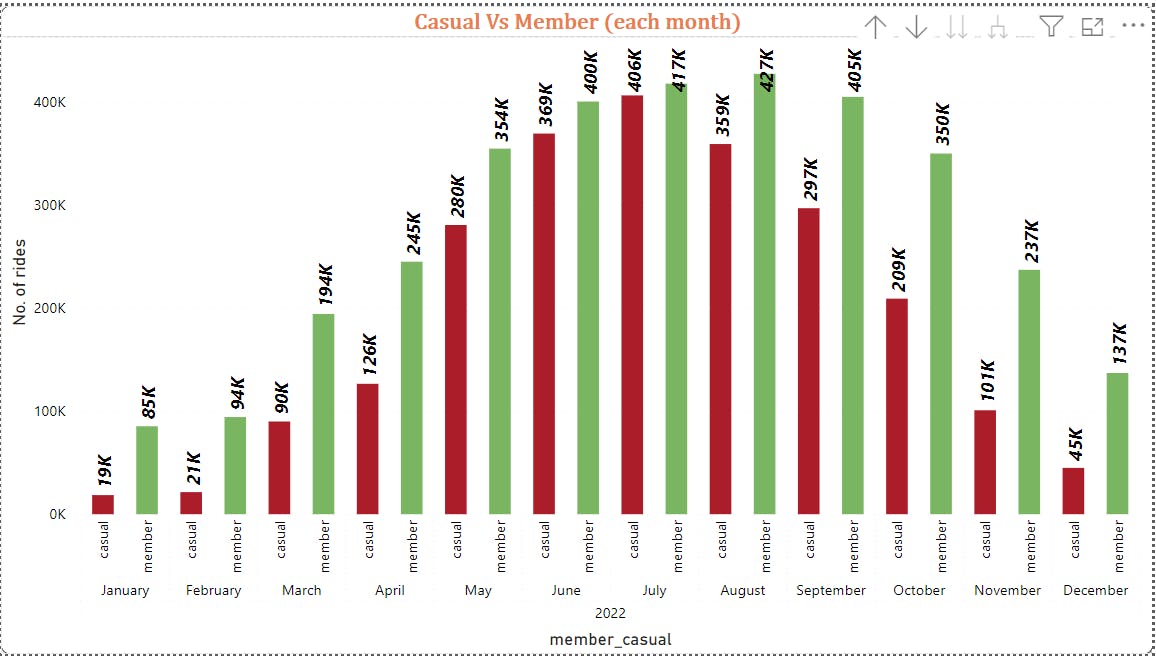
Casual riders and annual members both have the highest number of rides in July and August, respectively
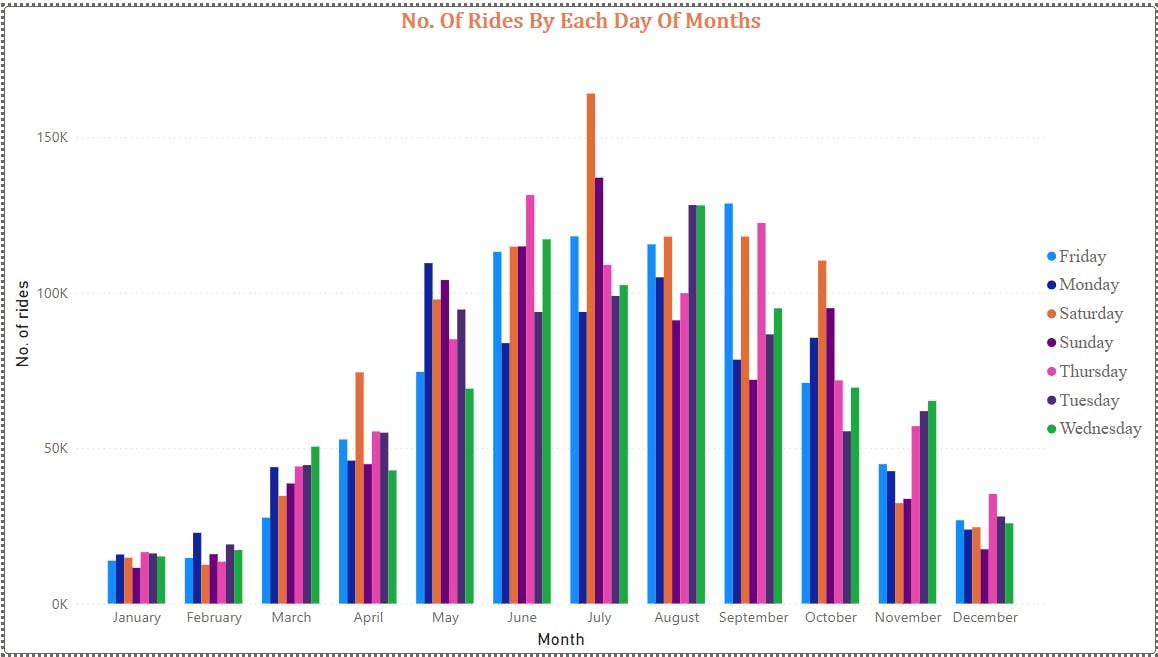
This graph displays the number of rides for each month, with Saturday having the maximum number of rides.
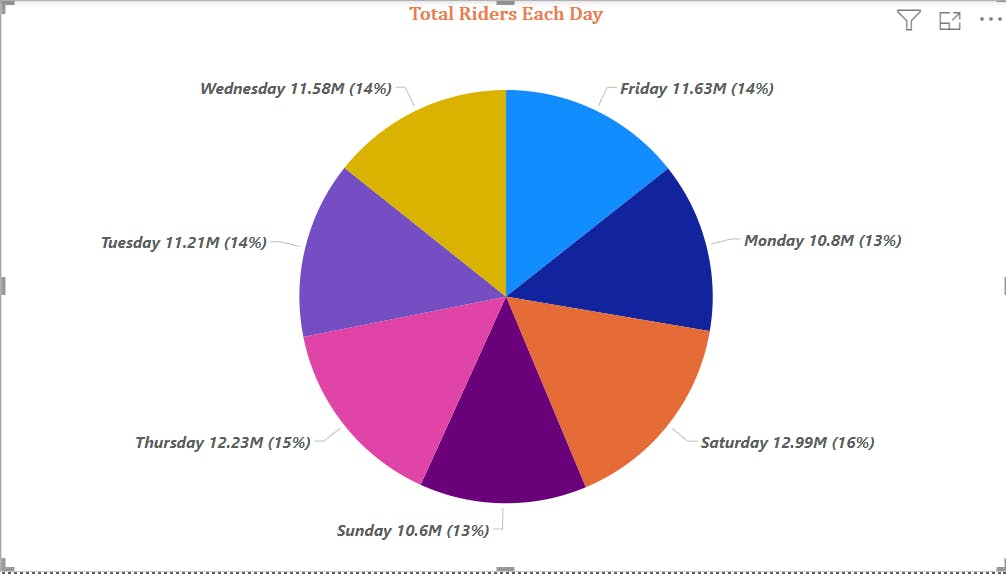
This pie chart also indicates that Saturday has the maximum number of rides, while Sunday and Monday have the least number of rides.
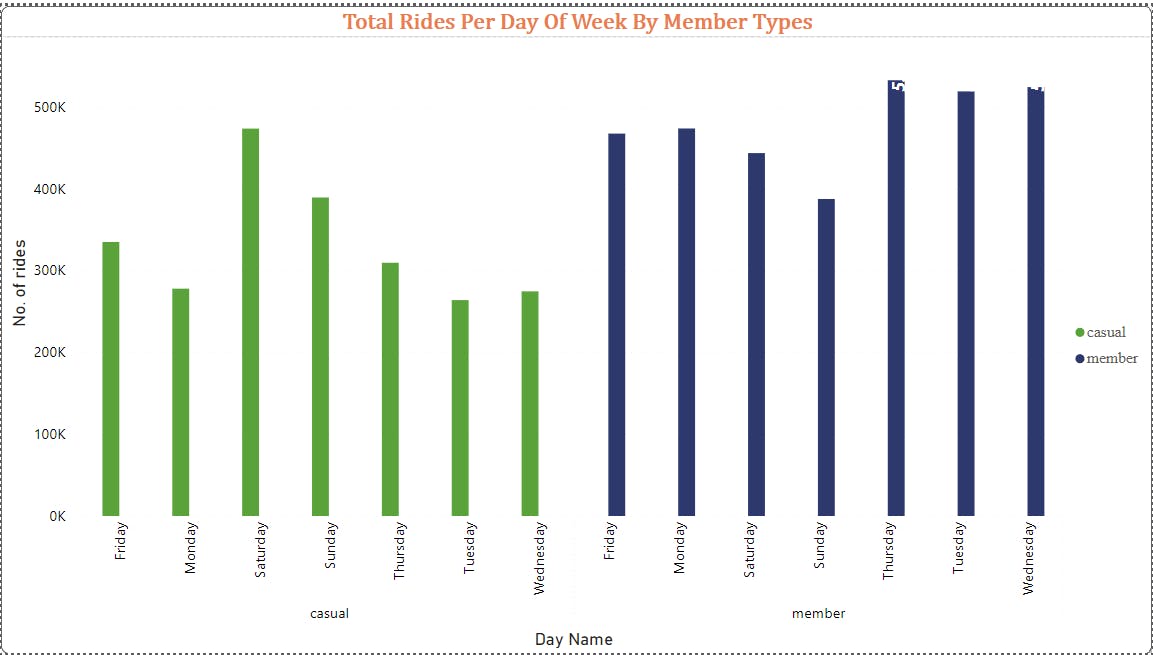
This also shows how casual riders and members use the bikes on different days
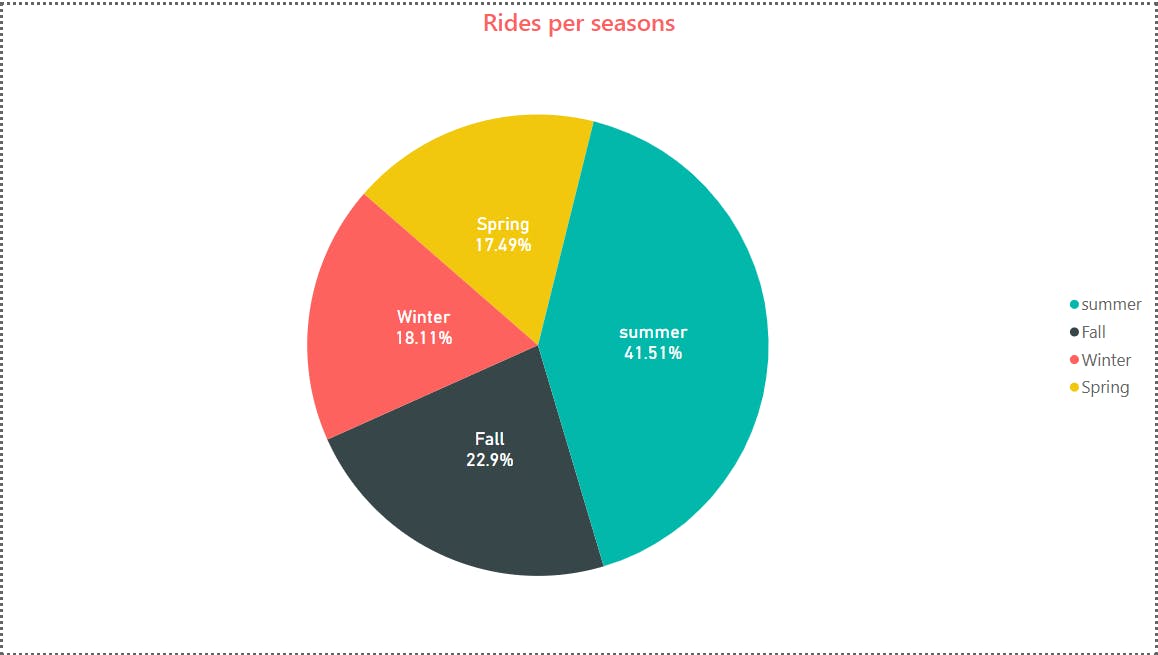
As we know, May, June, July, August, and September have the maximum rides, which clearly shows that the summer season is the busiest
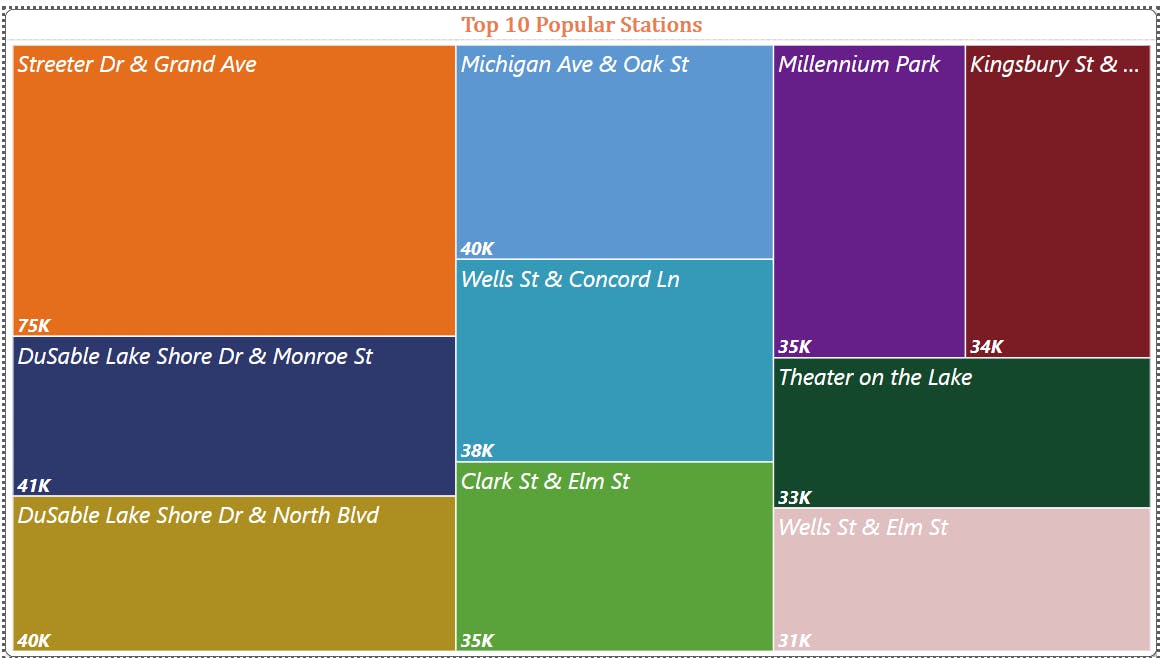
Top stations, according to the maximum number of rides, include Streeter Dr & Grand Ave, DuSable Lake Shore Dr & Monroe St, DuSable Lake Shore Dr & North Blvd, Michigan Ave & Oak St, and so on.
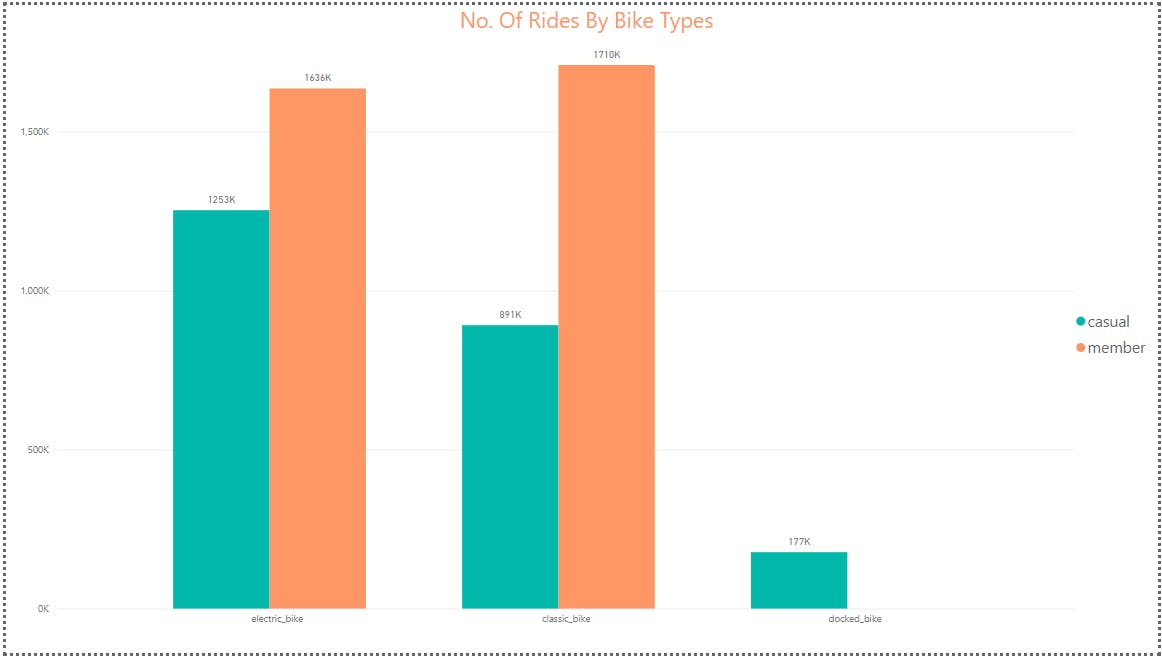
The most preferred bike type, according to the analysis, is the Classic bike, while the least preferred is the Docked bike.
My Presentation To The Stakeholders :